
Album Statistics with Python
In May of 2014, I released my first video game music album titled Aural Nostalgia Vol. 1 in partial fulfillment of the requirements to graduate from the Honors Institute at Michigan Tech.
Fast-forward three years and I have made somewhere in the realm of $200 to $300. The past several months my income from this album has been roughly $9/month. The company that distributes my album (and takes care of royalty payments to the copyright holders) is Soundrop and every month they send me a CSV file of the previous month’s transactions. This file contains a wealth of information that is tedius to go through by hand using MS Excel. So I put my coding skills to good use and wrote up a Python script that will read in the CSV file, parse the contents, and plot several variables as pie charts.
The variables I’m interested in are total quantities purchased or streamed as a function of service and total money earned as a function of track, country, and service. Figure 1 shows the total amount of streams or purchases by service. Spotify has the most streams at 87.7% and Apple Music has the second largest piece of the pie at 7.9%. Figure 1 shows that people stream my music more than they buy and download it.
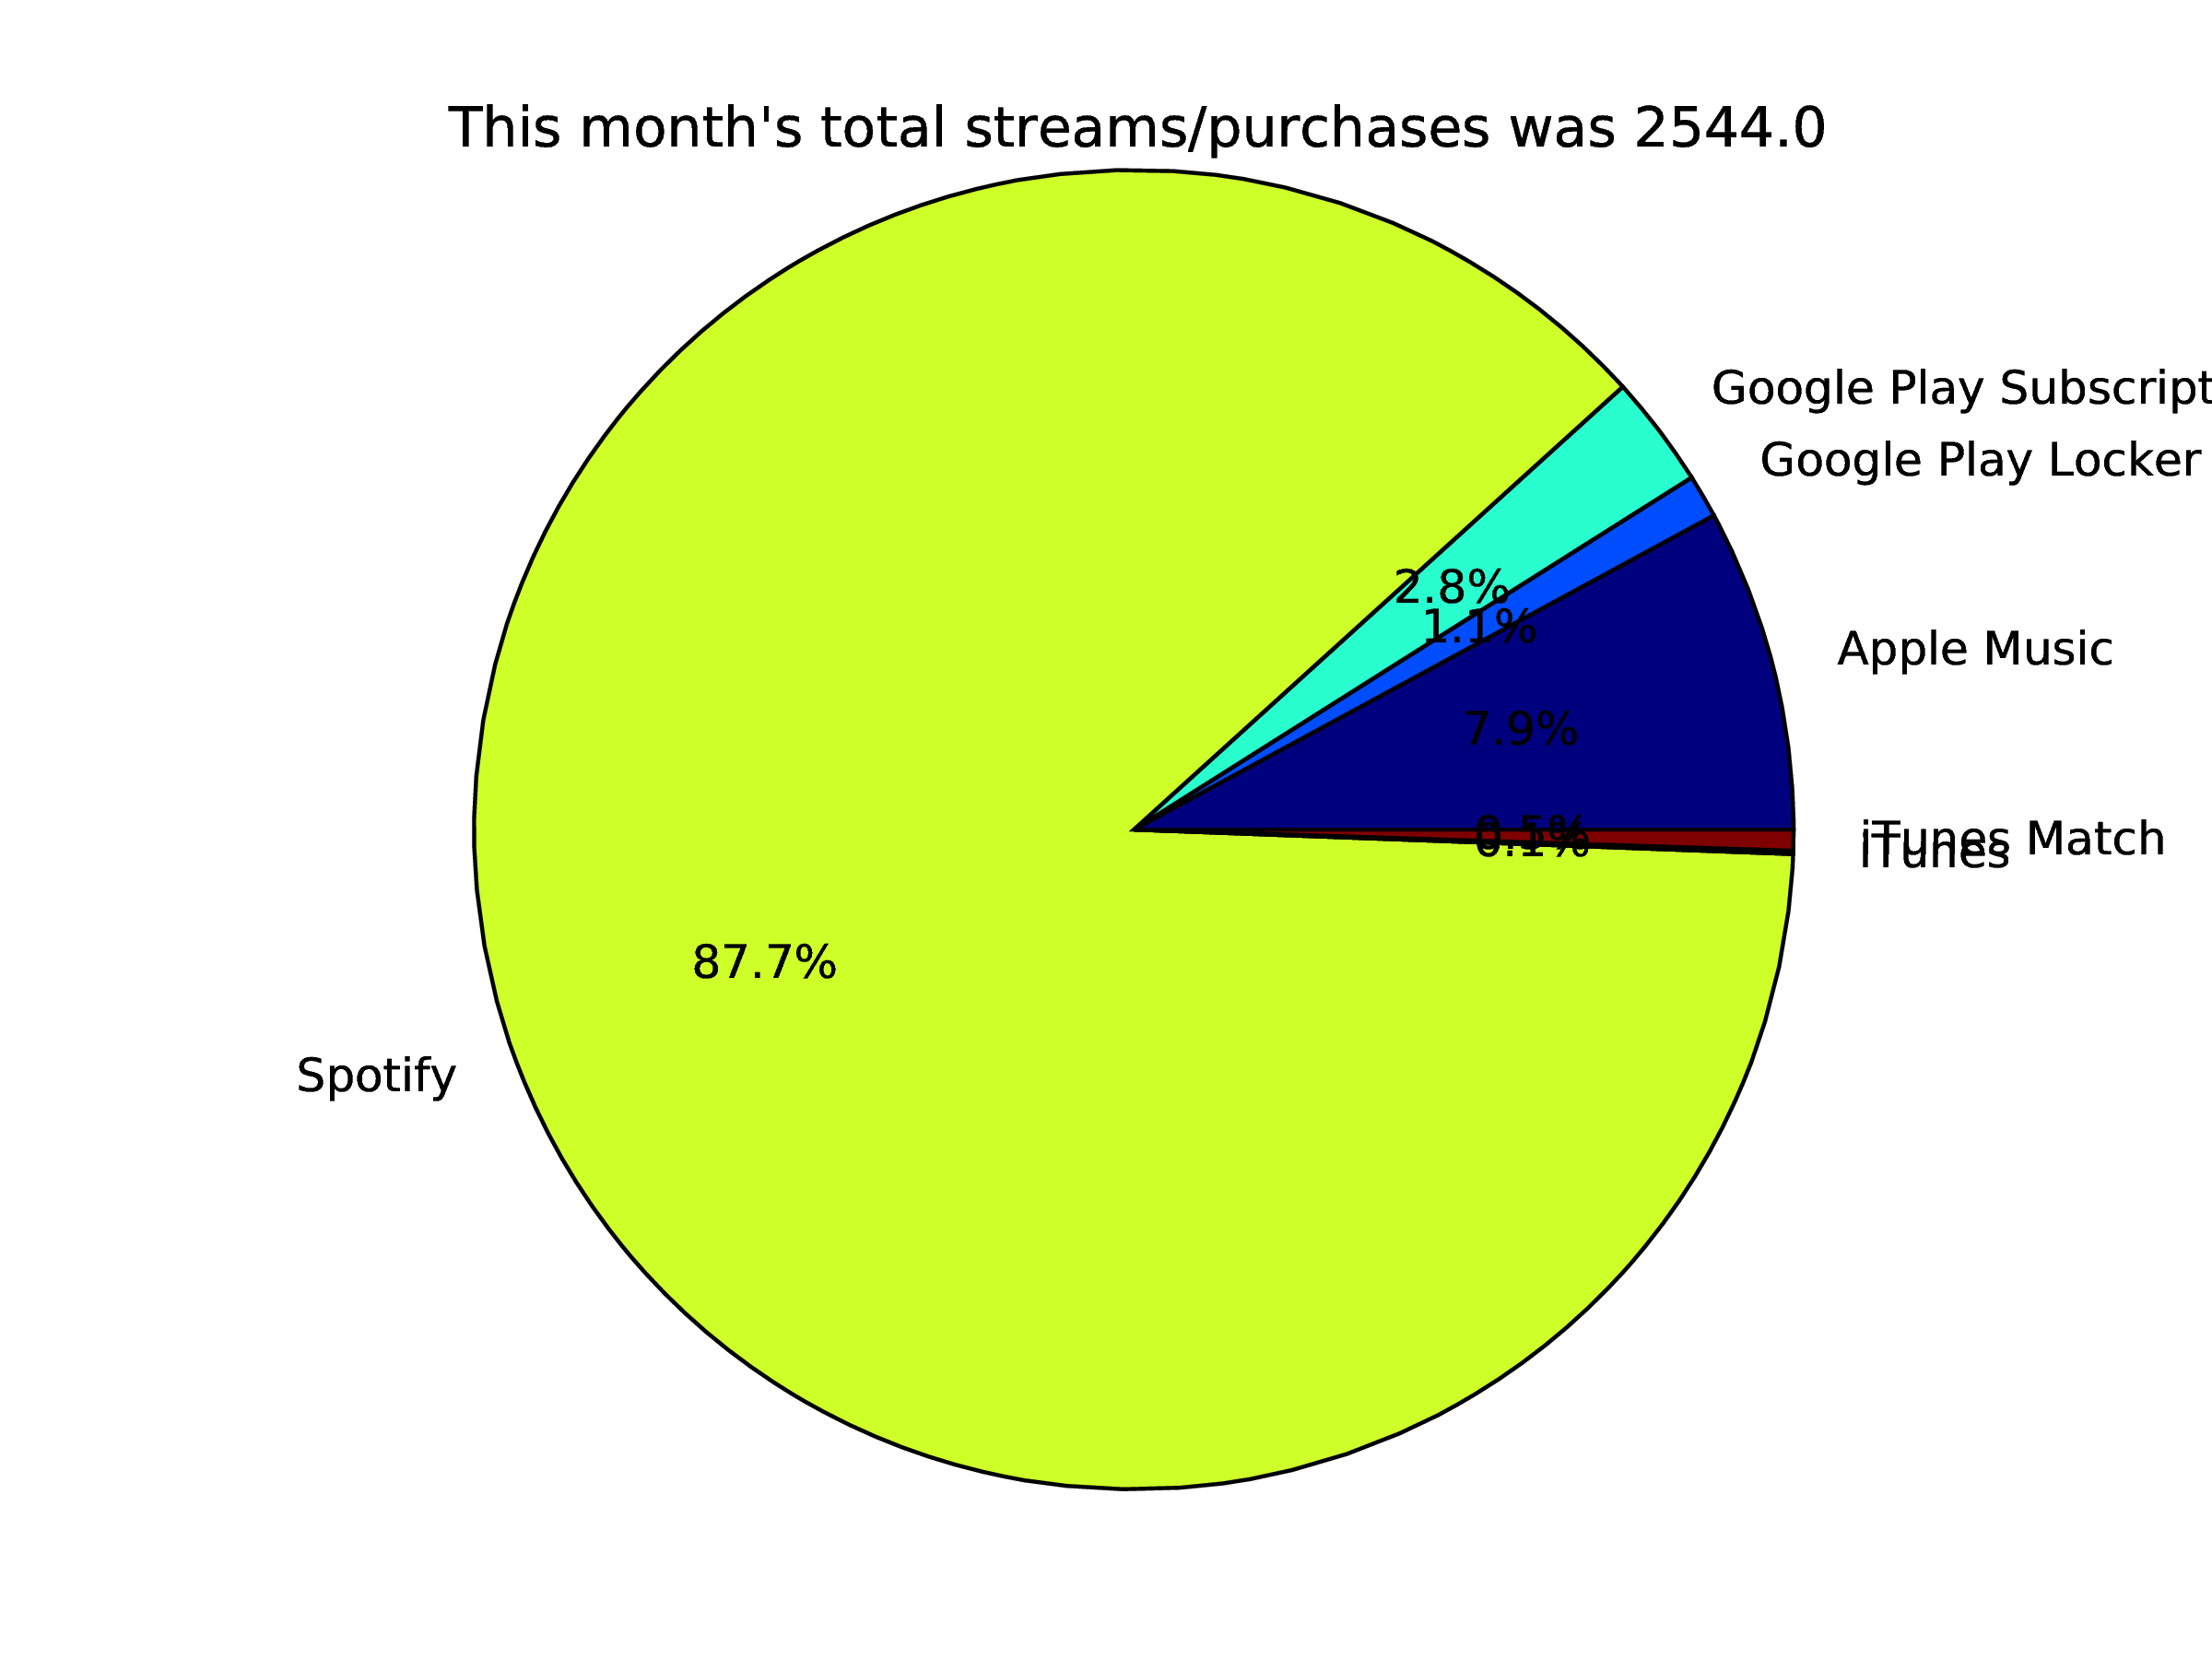
Figure 2 shows the income earned by country. Unsurprisingly, the United States makes up almost three-quarters of the pie. The “Other” category includes all countries with income less than 15 cents. I am surprised by how many countries (39!) listen to my music, though.
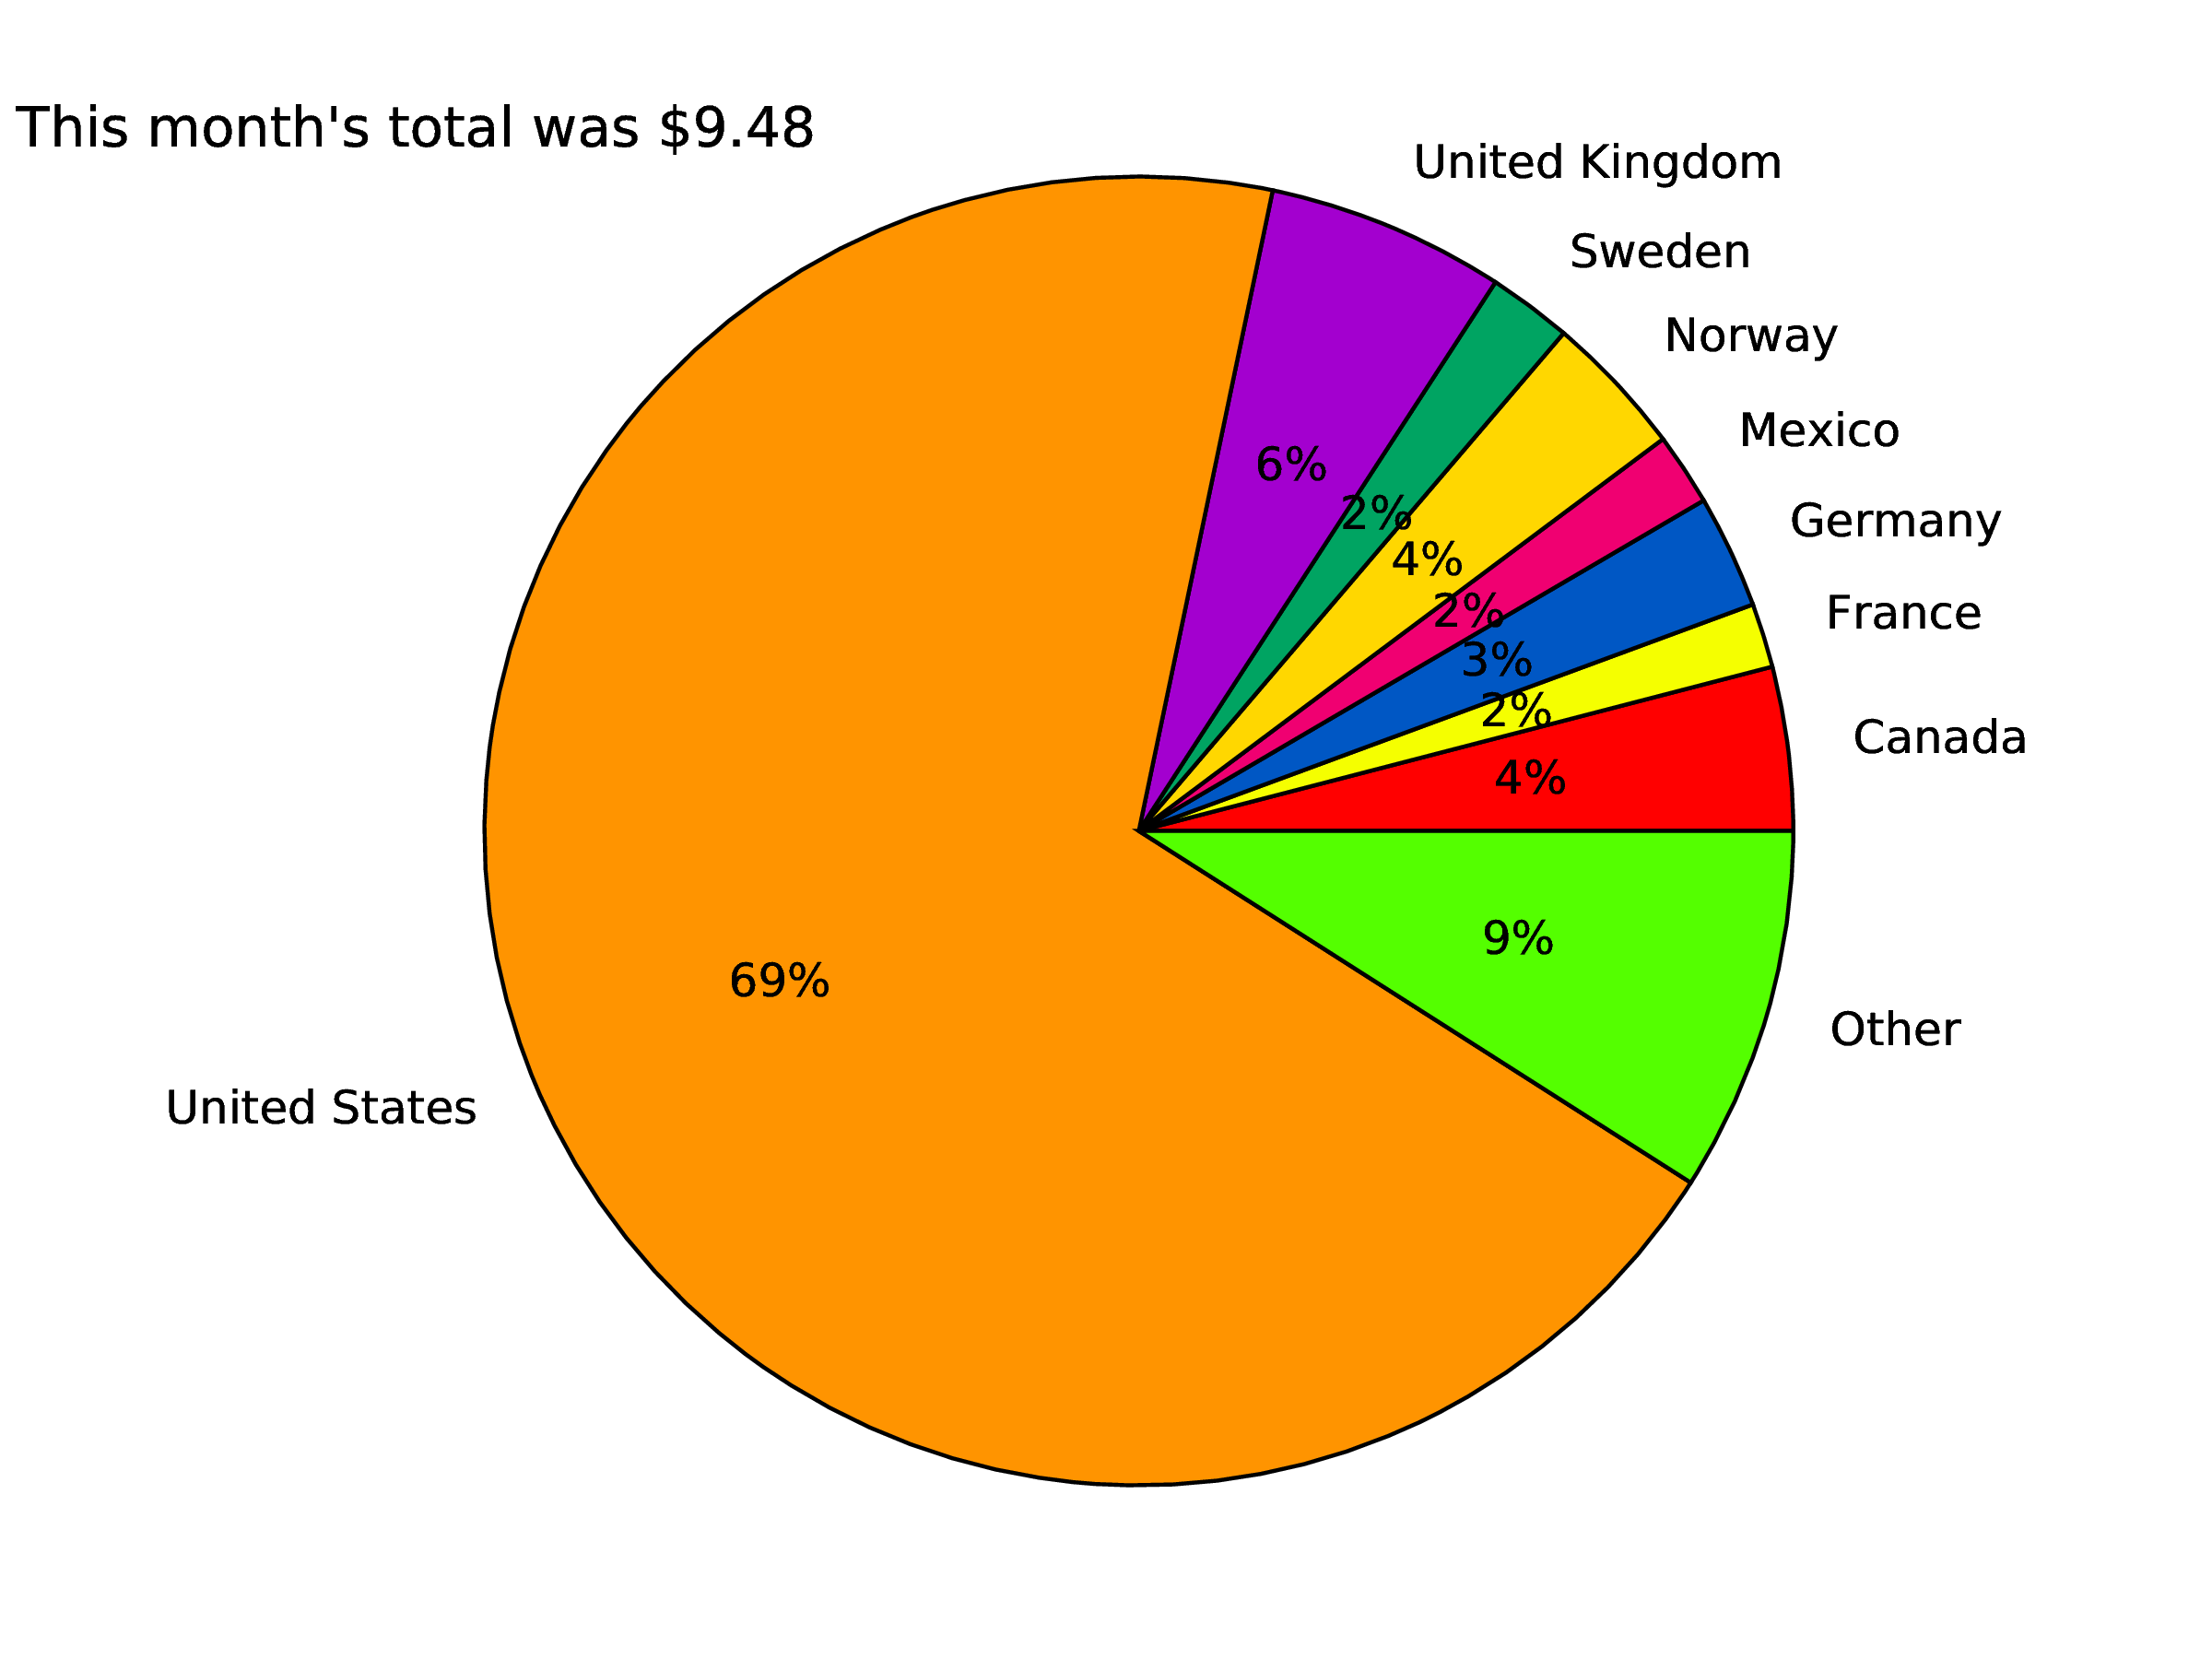
Figure 3 shows the income earned by service. Spotify again makes up the largest piece of the pie, which is a little surprising because streams earn less than purchases. As seen in Figure 1, there was a lot of streams this month. Unlike some other artists, I don’t mind people streaming my music instead of buying it outright. That’s what I do. I can’t even remember the last time I purchased music from iTunes, Google Play, or Amazon. I have backed a few Kickstarter albums, though.
Before now, I haven’t even heard of iTunes Match or Google Play Locker. It seems that iTunes Match lets you upload your own iTunes library (up to 100,000 songs) to the cloud for $25 a year so you can stream them from up to nine devices. So kind of like Google Music in the beginning except Google Music was free. So I guess artists still make money when a song is uploaded to the cloud via iTunes Match? It looks like Google Play Locker is similar, but is free and allows for 50,000 songs.
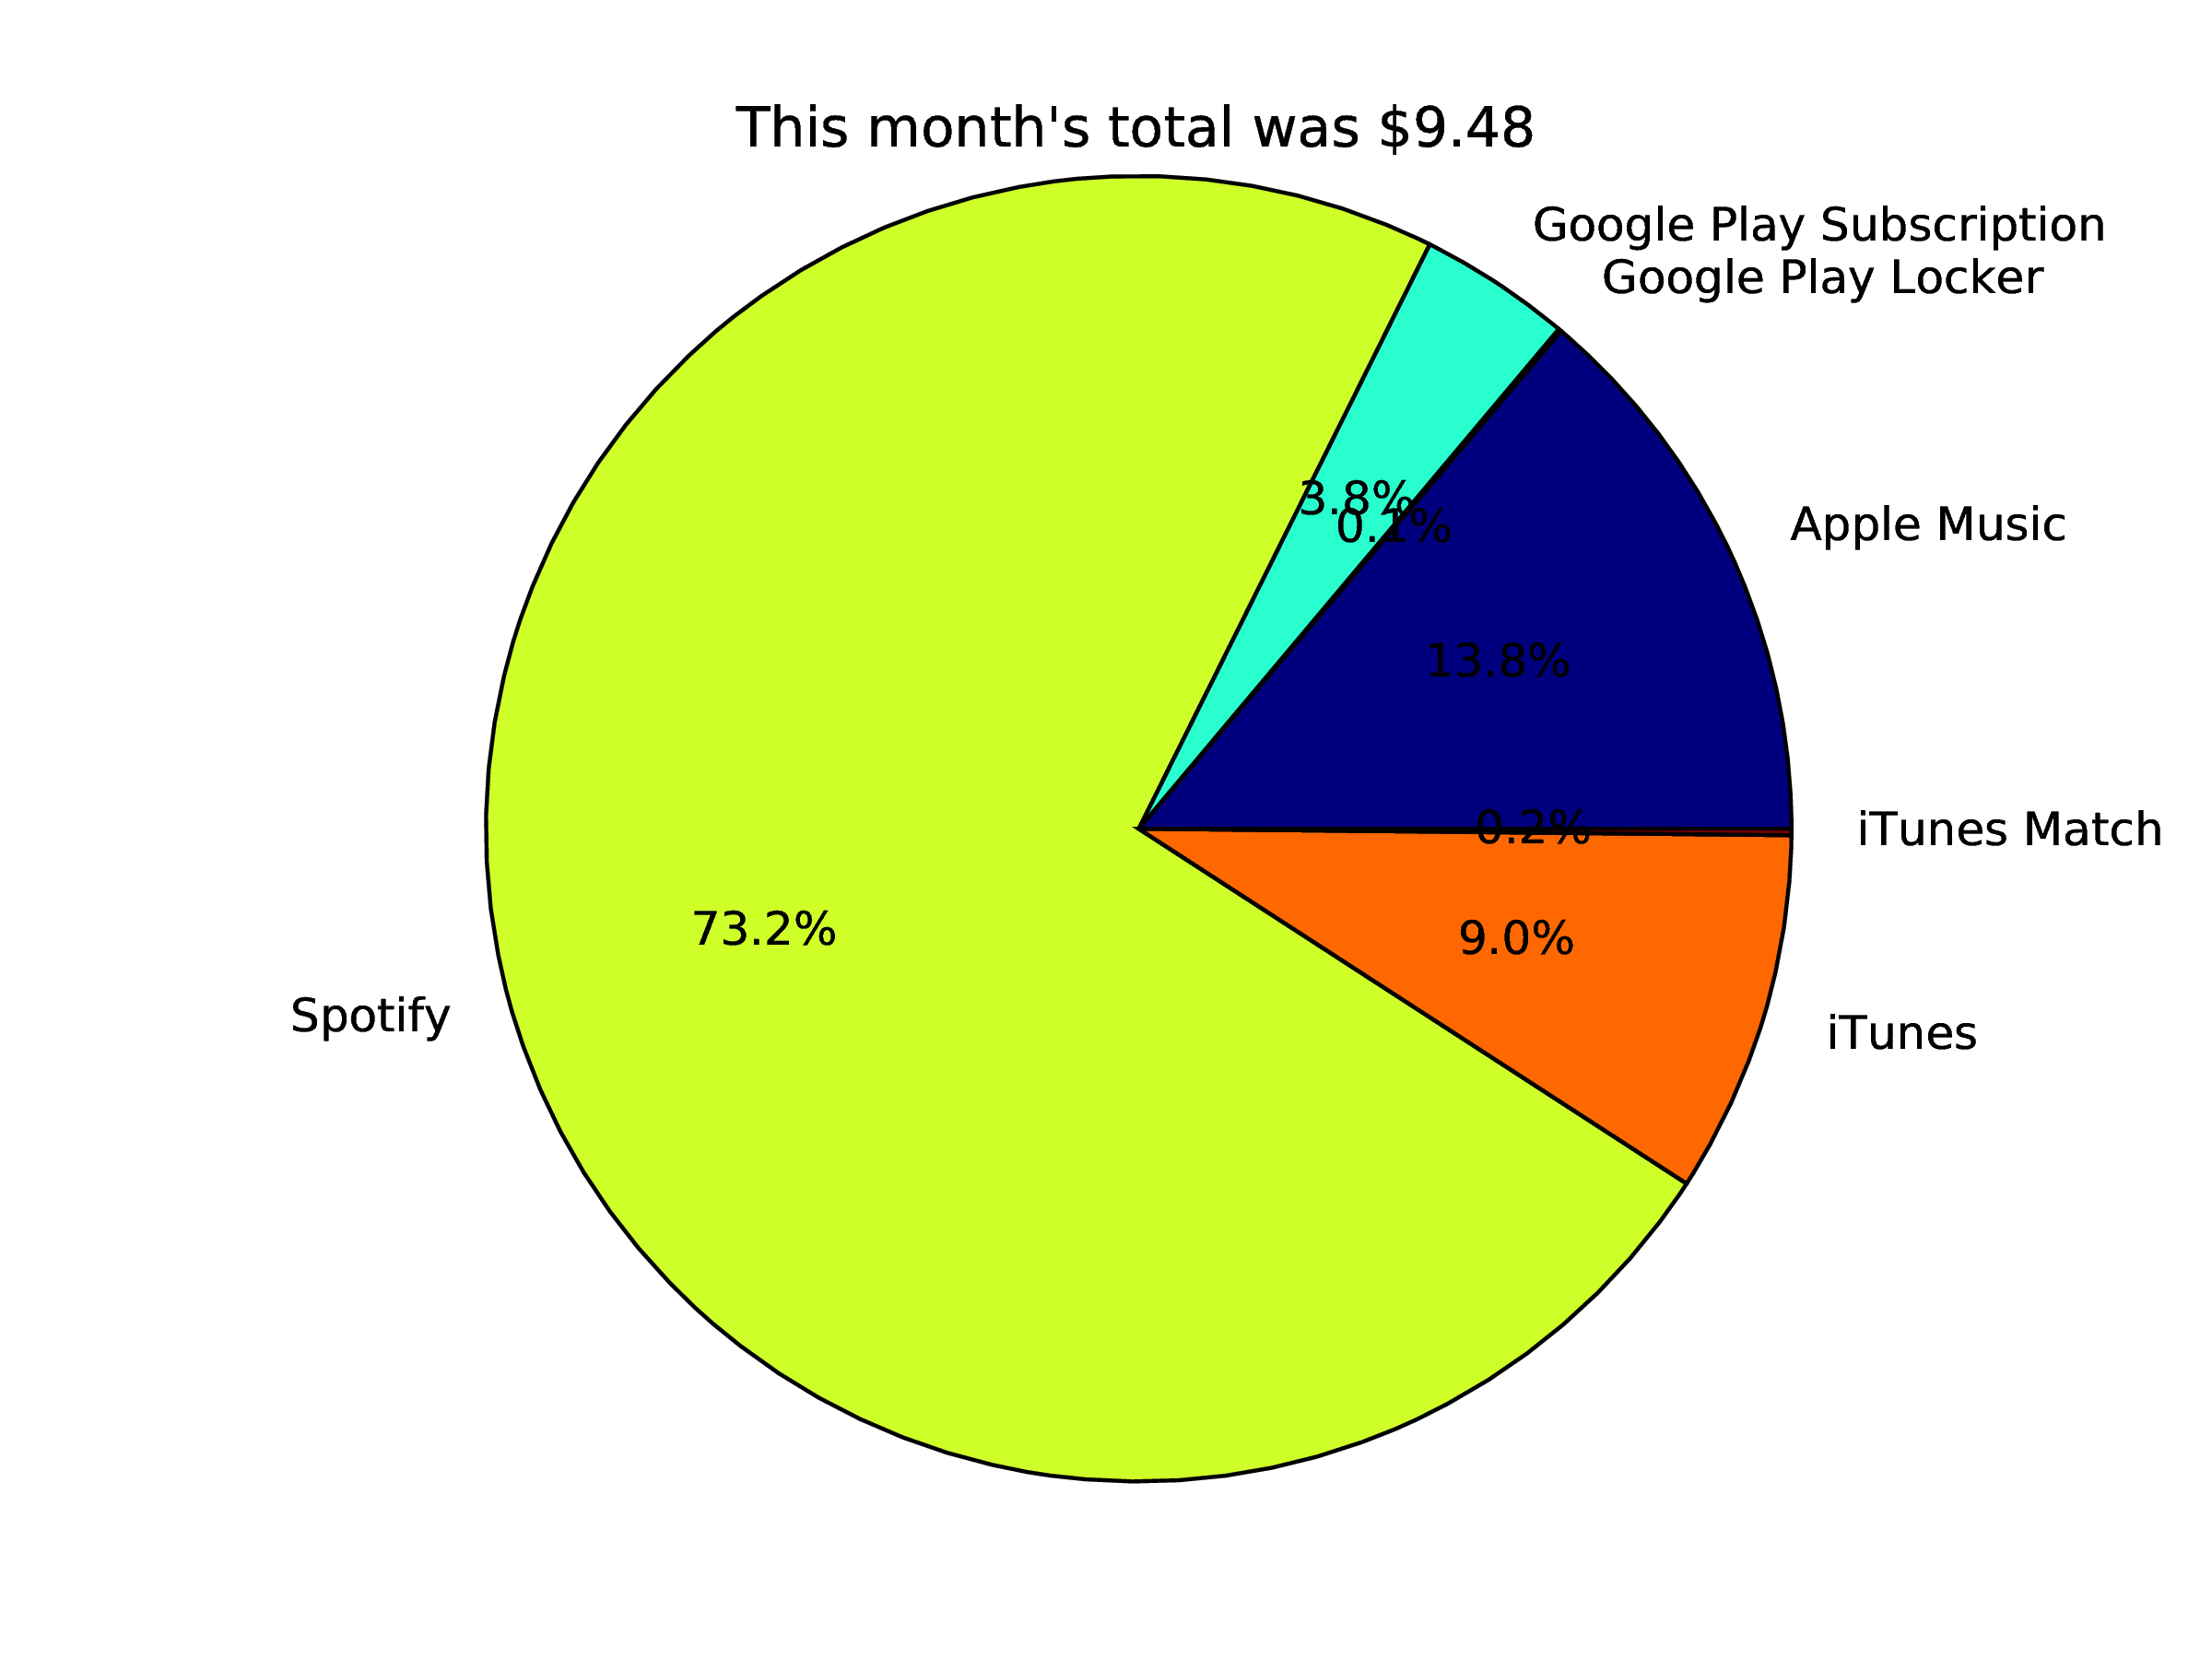
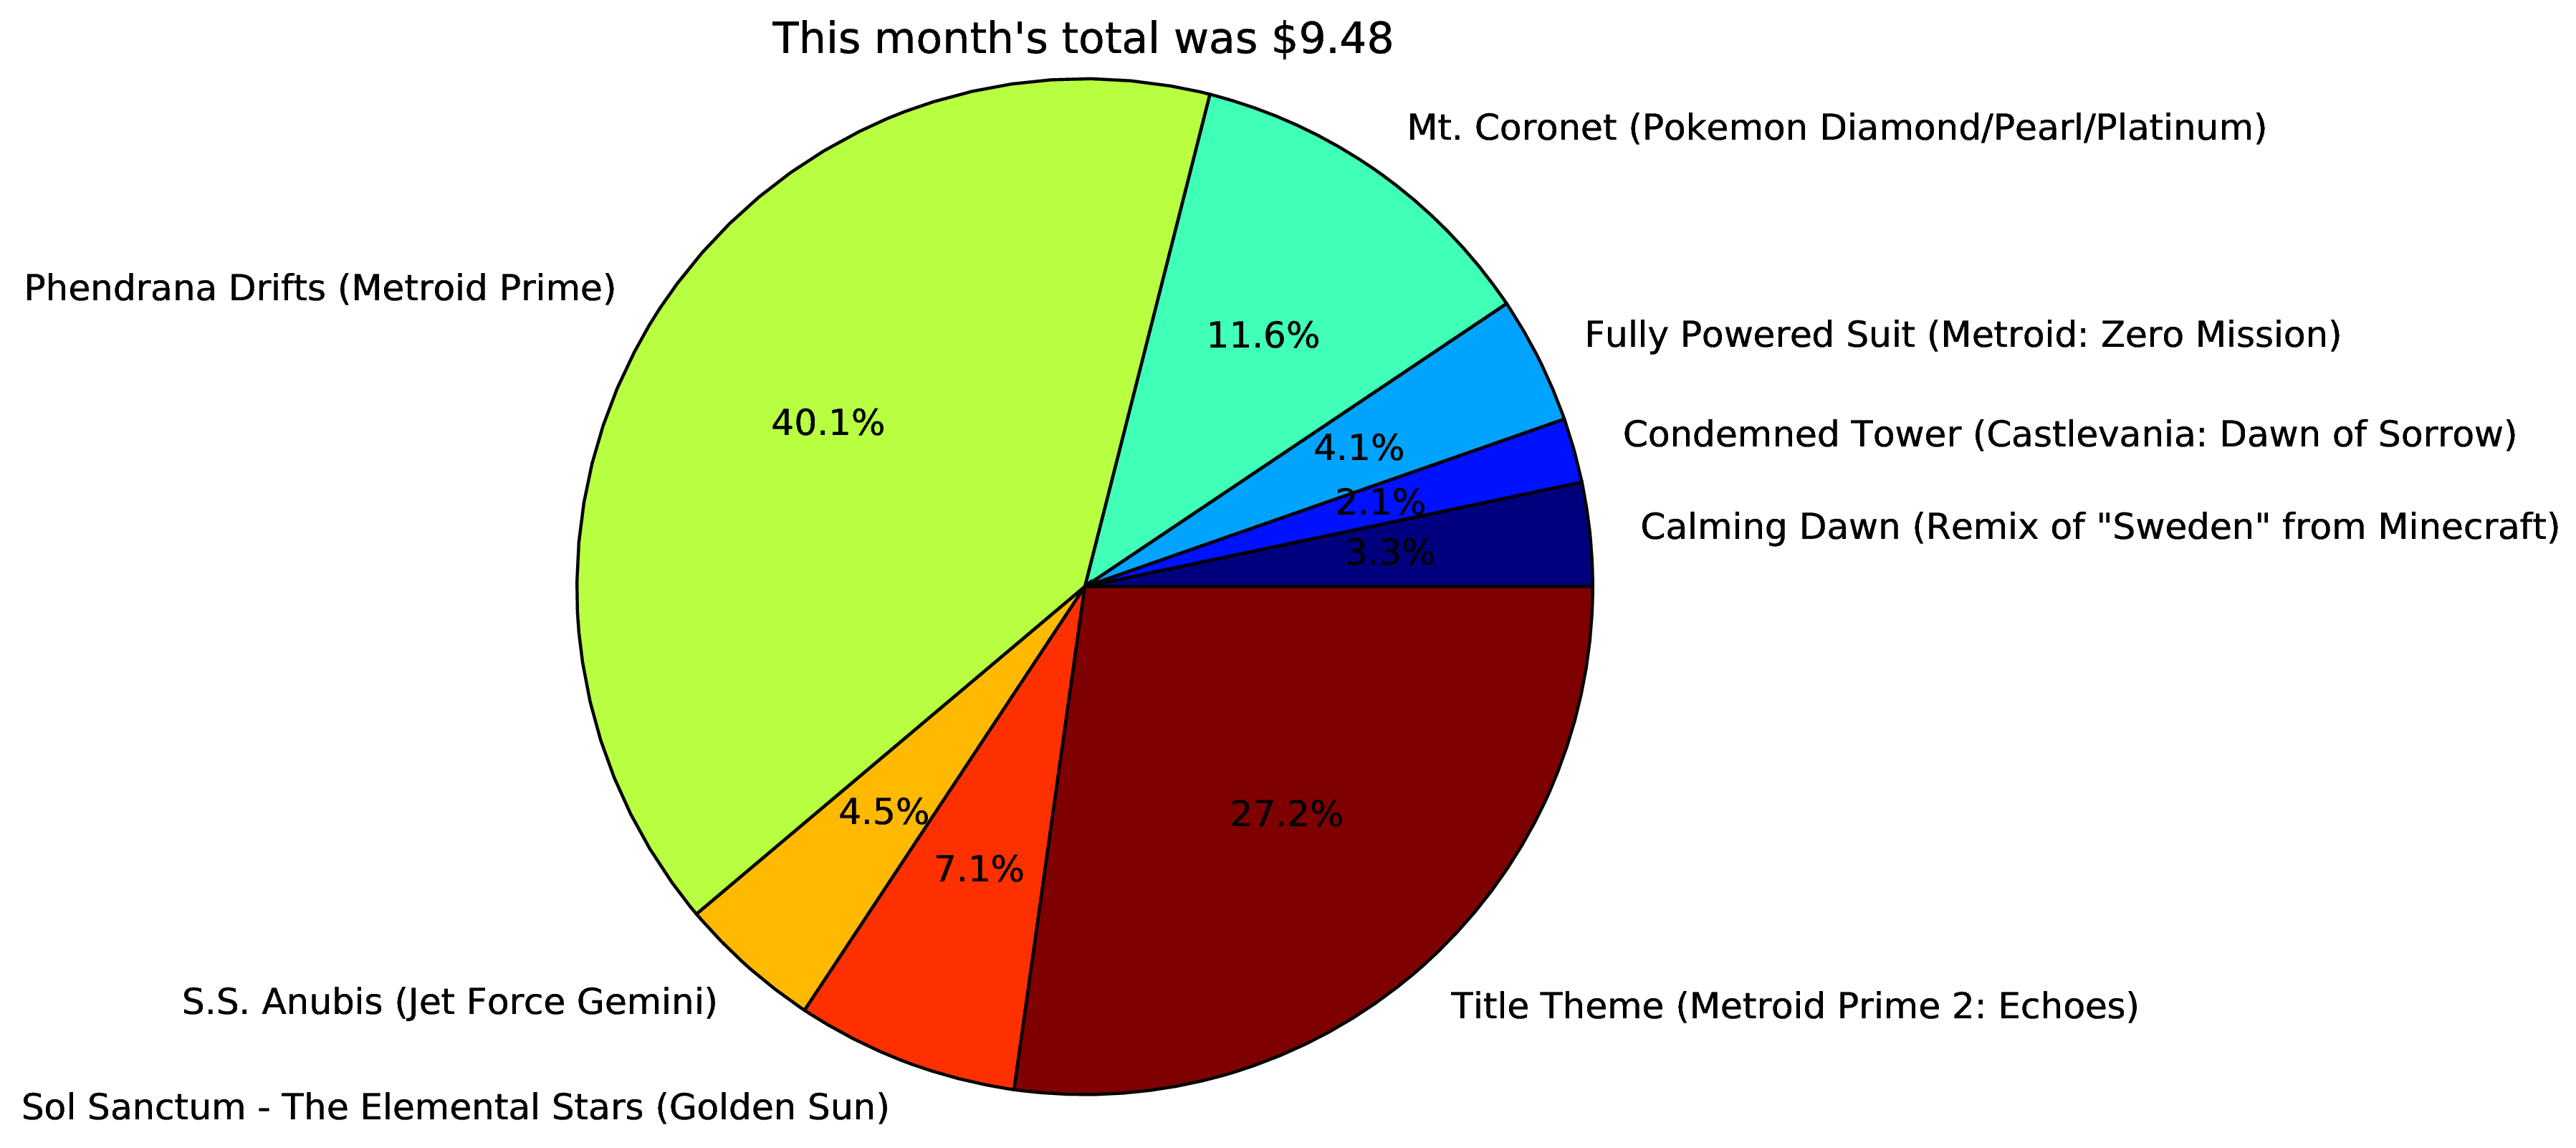
Figure 4 shows the total money earned by track. It appears that my arrangements of the two Metroid Prime 1/2 songs are the most popular followed by “Mt. Coronet” from Pokemon Diamond/Pearl/Platinum. Maybe I should release more Metroid Prime Trilogy music. Well, I do have four in the pipeline, at various stages of completion.
There are 587 words in this post.